To make bubble graphs automatically we can use macros.
Macro : A macro is a series of commands and functions that are stored in a Microsoft Visual Basic module and can be run whenever you need to perform the task. Confusing !!!
in simple terms - A macro is a recording of each command and action that are perform to complete a task. Whenever you need to carry out the same task you can just run the macro and the commands & actions are performed.
important thing-- The excel workbook must be a macro enabled workbook.
Step one
 |
| In the view tab click on macro button |
Step two
You will get a window, type an name and click on create.
Step three
paste the below code in to the window
MACRO CODE
Step Four
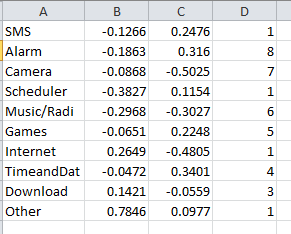
The data should be in this format
Step Five
--->Select the data
--->Click on macros -- select the macro --- click on run
you will get your graph automatically
//Code borrowed from MSDN blog (small changes were made)
paste the below code in to the window
MACRO CODE
Public Sub BubbleGraph()
    If (selection.Columns.Count <> 4 Or selection.Rows.Count < 3) Then
        MsgBox "Selection must have 4 columns and at least 2 rows"
        Exit Sub
    End If

    Dim bubbleChart As ChartObject
    Set bubbleChart = ActiveSheet.ChartObjects.Add(Left:=selection.Left, Width:=400, Top:=selection.Top, Height:=250)
    bubbleChart.chart.ChartType = xlBubble
    Dim r As Integer
    For r = 2 To selection.Rows.Count
        With bubbleChart.chart.SeriesCollection.NewSeries
            .Name = "=" & selection.Cells(r, 1).Address(External:=True)
            .XValues = selection.Cells(r, 2).Address(External:=True)
            .Values = selection.Cells(r, 3).Address(External:=True)
            .BubbleSizes = selection.Cells(r, 4).Address(External:=True)
        End With

    Next

    bubbleChart.chart.SetElement (msoElementPrimaryCategoryAxisTitleAdjacentToAxis)
    bubbleChart.chart.Axes(xlCategory, xlPrimary).AxisTitle.Text = "=" & selection.Cells(1, 2).Address(External:=True)

    bubbleChart.chart.SetElement (msoElementPrimaryValueAxisTitleRotated)
    bubbleChart.chart.Axes(xlValue, xlPrimary).AxisTitle.Text = "=" & selection.Cells(1, 3).Address(External:=True)

    bubbleChart.chart.SetElement (msoElementPrimaryCategoryGridLinesMajor)
End Sub
Click "Compile VBAProject" (VVV IMP)
Step Four
The data should be in this format
Step Five
--->Select the data
--->Click on macros -- select the macro --- click on run
you will get your graph automatically
you can assign shortcuts to the macros and make them run with out clicking on macro names and run.
click on options and assign the shortcut key.
//Code borrowed from MSDN blog (small changes were made)


No comments:
Post a Comment